Graphic Display of a Variable Locations By Box Plot:
This article provides an overview of box plot as a tool for displaying the distribution of a variable's values across multiple locations.

The way of representation of numeric variables and the distribution of a set of data is known as a box plot. But with the help of a box plot calculator, you can get a graphic display that gives powerful distribution insights. A boxplot (also known as a whisker plot) consists of a rectangular box with vertical lines that indicate the median and range of the data, excluding outliers.
With the help of a box and whisker plot calculator, you can also captivate the variable locations and get the answer with remarkable clarity so we can say that it is a powerful data exploration and analysis tool.
Let us move on toward the depth discussion to explore the graphic display of various locations and know about their applications. Stay focused and read on!
What Is a Box Plot In Statistics?
The tool is a way to summarize the set of data in the form of a graph. The shape of a dataset reveals how the data is distributed and how it was gathered. In this way, you can compare the data set with others by sketching more boxplots on the graph.
“In a simple and comprehensive tone, we say that in statistics the type of chart that shows a group of numerical data is called a box plot.” The other name of it is the whisker plot. You can summarize the set of data with the help of a box plot calculator.
Types of Box Plots:
A box plot calculator can quickly summarize the different values in a data set. It shows the fast calculations by representing the median, upper and lower quartiles as well as their minimum and maximum values in the dataset.
There are two most commonly used types of the tool that are as follows:
- Variable width
- Notched
The Procedure To Make a Box Plot:
The tool allows you to generate the sketch from the set of statistical data. Follow the below points and explore how this daunting task is done.
- Arrange your data set values from smaller numbers to the greatest number
- Get the knowledge of the limits of the dataset or the lower and upper extremes
- Identify the median and range of the given data set
- Identify the median of the upper and lower quartiles and their central value
- Create a box and whisker plot
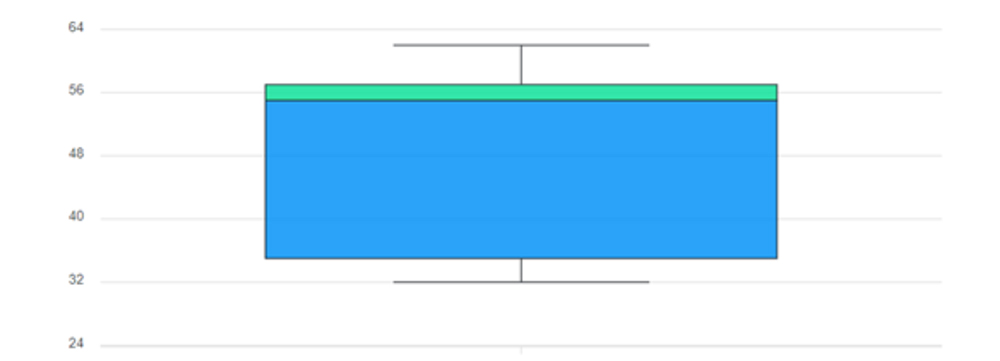
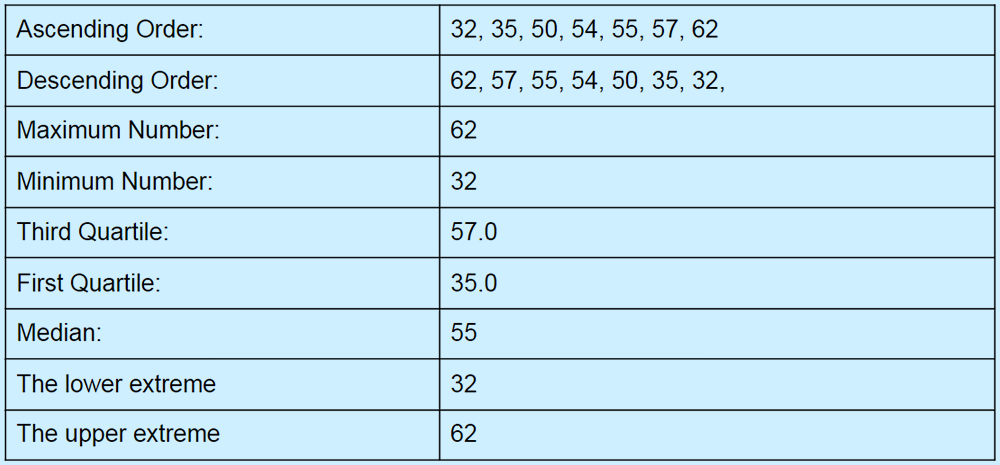
Example:
Suppose a dataset 55, 62, 35, 32, 50, 57, 54, and we need to estimate the distribution of the data set and draw their sketch.
Solution:
The Strengths:
A box plot calculator is a way to understand the statistical data and allows you to create a diagram to clarify the concept. The strengths mean their applications are in the below-given points. Look at these:
- It provides a summary of data symmetry
- It shows outliers as other methods display
- It is used to display the locations and spread at a glance
- Dataset with others by using it on the same graph
- The median expected range in the box can be shown by using the notches
- The width of the log can variate with the sample size in proportion to the log.
Graphic Representation of a Dataset: