Track What Actually Drives Revenue
Focus on the right RevOps KPIs to align teams, improve performance, and make smarter, data-driven decisions.
![]() Lead-Gen now on Auto-Pilot with
Build My Campaign
Lead-Gen now on Auto-Pilot with
Build My Campaign
Discover the RevOps KPIs and metrics that matter most to track performance, align teams, and drive predictable revenue growth.
Track What Actually Drives Revenue
Focus on the right RevOps KPIs to align teams, improve performance, and make smarter, data-driven decisions.
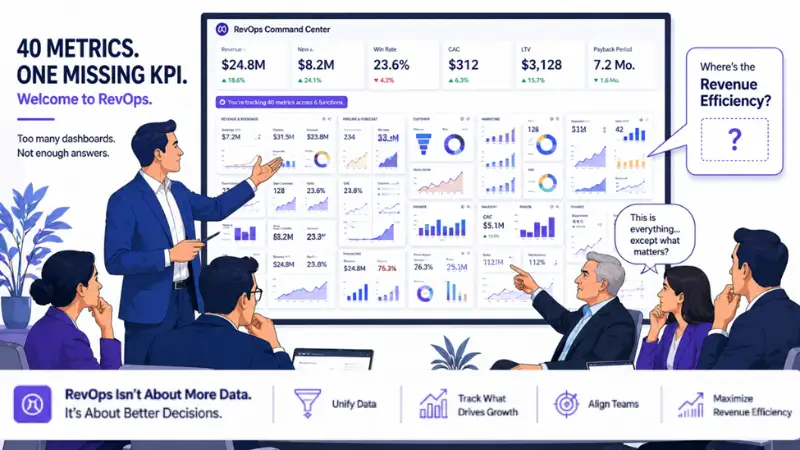
A RevOps leader walks into the boardroom with a polished, color-coded dashboard showing 40 metrics. The CFO studies it for three seconds, asks one question no one tracked, and the meeting is effectively over.
The issue is rarely a lack of data. It is usually poor selection. Many RevOps teams measure what is easiest to extract rather than what is most important to understand. When the business sells services instead of software licenses, that gap widens quickly.
Service pipelines follow a different logic. Sales cycles are longer, relationships carry more weight, handoffs between sales and delivery are less clean, and the boundary between customer success and new revenue is far less defined than most dashboards suggest.
This blog cuts through the metric overload and focuses on the KPIs that genuinely indicate revenue health, especially for professional services, managed services, consulting, and businesses where expertise and relationships are the core offering.
Not intentionally. But numbers that do not guide decisions are merely white noise made to look important.
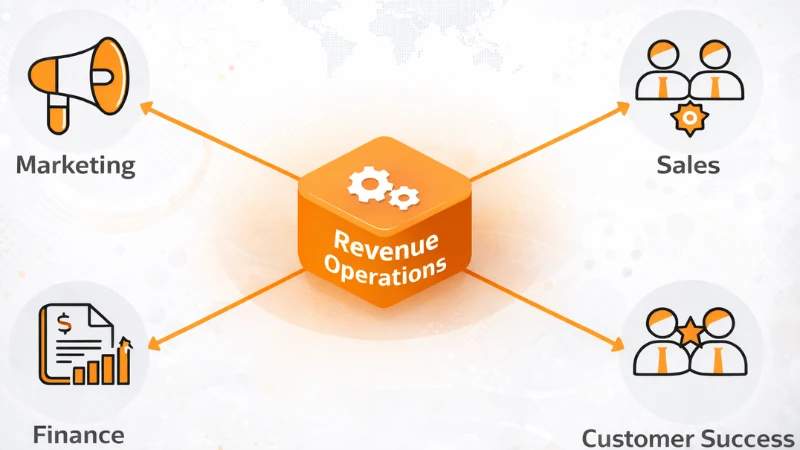
The research backs this up: According to Forrester research, companies that align people, processes, and technology across revenue teams report 36% higher revenue growth and up to 28% greater profitability than those without a functioning RevOps model. But the keyword is functioning. Tracking 47 metrics across disconnected systems doesn’t create a RevOps function. It creates a reporting backlog that everyone ignores. To understand the operating model behind performance, explore what RevOps actually means for modern B2B teams.
Track What Actually Drives Revenue
Focus on the right RevOps KPIs to align teams, improve performance, and make smarter, data-driven decisions.
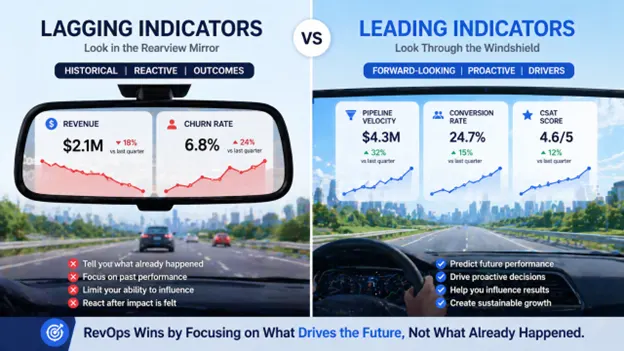
Before we get to specific KPIs, here’s the framing that matters: there are two types of metrics in RevOps. Lagging indicators tell you what already happened (revenue, churn, closed deals). Leading indicators tell you what’s about to happen (pipeline velocity, conversion trends, Customer Satisfaction Score (CSAT) that are quietly moving south).
A dashboard without leading indicators is a rearview mirror. Useful sometimes. Dangerous if that’s all you’re watching.
Still tracking metrics no one uses?
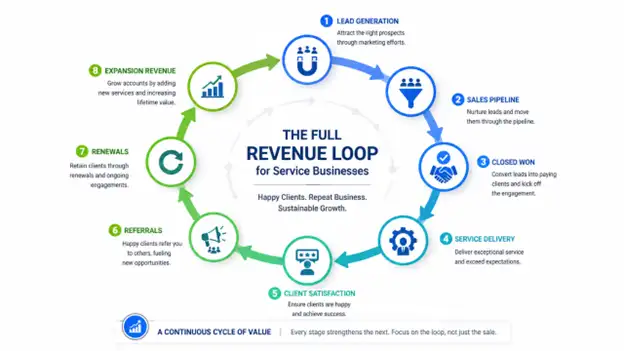
This is the gap most RevOps content misses entirely. For service businesses, the pipeline doesn’t end at “closed won.” It starts there. Your delivery quality feeds directly back into pipeline health through referrals, renewals, expansion revenue, and reputation. That means your RevOps metrics need to span the full loop, not just the front end of the funnel.
Here’s what that actually looks like in practice.
Pipeline velocity measures how fast deals move through your funnel and convert to revenue. The formula:
(Number of Opportunities x Average Deal Value x Win Rate) / Sales Cycle Length
Why it matters for service businesses specifically: service sales cycles are notoriously long. Enterprise consulting deals can stretch six to twelve months. If your velocity is slowing but your pipeline volume looks healthy, something is rotting in the middle of your funnel. That’s usually a qualification problem, a proposal quality problem, or a handoff problem between sales and the delivery team that’s spooking buyers before they sign.
Track velocity monthly. Segment by source (inbound referral vs. outbound), by deal size, and by service line. The average will always hide the variance that actually matters.
2026 benchmark: Healthy service businesses see velocity improvements of 15-20% year-over-year when RevOps is actively working the funnel. If yours is flat or declining, the conversation you need to have isn’t about sales. It’s about the process.
Coverage ratio is pipeline value divided by quota. Simple arithmetic with non-obvious implications.
The widely repeated “3x coverage” rule is outdated. That benchmark came from high-velocity SaaS sales with predictable win rates. Service businesses with longer cycles and lower (but higher-value) deal volumes often need 4x to 6x coverage, especially if win rates sit below 25%.
Calculate your actual required coverage based on your historical win rate. Don’t borrow benchmarks from a business model that looks nothing like yours.
For service pipeline management, coverage also needs to account for scope creep and project delays that shift revenue recognition. A deal that closes in Q3 but doesn’t start delivering until Q2 next year is a coverage gap you won’t see until it’s too late.
Win rate measures the percentage of qualified opportunities that close. Average for B2B: around 21% overall, rising to 29% when you filter for properly qualified opportunities only.
For services, a below-average win rate usually points to one of three things: you’re pitching to the wrong buyers (qualification problem), your proposals don’t demonstrate enough differentiation (positioning problem), or your buyers are getting cold feet because they can’t picture what delivery actually looks like (trust problem). That third one is unique to services and it’s chronically underdiagnosed.
If your win rate is improving but average deal size is shrinking, congratulations, you’re getting better at closing the wrong deals. Segment win rate by deal size and service type. Small victories in unprofitable engagements aren’t victories.
Poor forecast accuracy is almost always a data quality problem. When 30-40% of your pipeline lacks verified buying signals, every forecast is optimistic fiction.
Target: within 10% of actual closed revenue. Most service businesses operate with 20-30% variance, which is expensive. Finance can’t plan headcount. Operations can’t staff delivery. The whole organization runs defensively.
The fix isn’t better forecasting tools. It’s better pipeline hygiene. Once fundamentals are in place, the right B2B revenue tech stack helps scale reporting and automation. Clean stage definitions. Mandatory fields that reflect real buyer engagement. A RevOps-led audit of deals that have been sitting in “proposal sent” for 90 days.
One thing service businesses deal with that SaaS companies don’t: scope changes that alter deal value after qualification. Build a process for re-forecasting when scope shifts. Otherwise, your forecast reflects the original deal while the actual revenue is something else entirely.
Forecasts off by 20%+? That usually means deeper RevOps issues.
CAC tells you what it costs to land a client. LTV tells you what that client is actually worth. The ratio between them tells you whether your business model makes sense.
Healthy ratio: 3:1 or better (LTV to CAC)
Below 3:1 and you’re acquiring clients you can’t afford. Above 5:1 and you’re probably underinvesting in growth. For services specifically, CAC should include sales team costs, proposal development time, pitch decks, travel, and any pre-sales discovery work. Most service businesses undercount CAC because they treat proposal time as “free.”
LTV for service clients is also more nuanced than a subscription business. A client who signs a one-year engagement and renews for three more has dramatically higher LTV than a one-and-done project client. That distinction should inform how you qualify, how you price, and how you allocate sales resources.
Segment LTV:CAC by service line and client segment. Some of your “best” clients by revenue are your worst clients by profitability. RevOps should be surfacing that data so leadership can make informed decisions about where to grow.

NRR measures whether your existing clients are growing, shrinking, or leaving. It accounts for upsells, cross-sells, downgrades, and churn.
Above 110% is solid. Above 125% is exceptional. Below 100% means your existing book is actively shrinking.
For service businesses, NRR is arguably more important than new logo acquisition. Expanding a relationship with an existing client costs roughly 20-30% of what acquiring a new one does. If your NRR is below 100% and you’re compensating by constantly chasing new logos, you’re running a leaky bucket strategy. It works until it doesn’t.
The RevOps responsibility here is making expansion revenue visible, measurable, and operational. Not a happy accident when a client calls with a new project. An intentional motion driven by data on client health, usage patterns, and relationship depth.
For service businesses, this metric has a signal inside the signal. Track conversion rate by source, and you’ll almost certainly find that referrals from existing happy clients convert at 2x to 3x the rate of cold outbound or paid channels.
That’s not surprising. It’s a reminder that your delivery quality is your best pipeline generator. A client who loves working with you becomes a revenue source in two ways: direct expansion and indirect referral. RevOps should be tracking referral-sourced pipeline as its own segment, measuring its conversion rate, and reporting it to leadership as evidence of delivery quality’s commercial value.
Average lead-to-MQL conversion: ~13%, with strong programs hitting 20%+. If yours is below 10%, look at the top of the funnel before you blame the sales team.
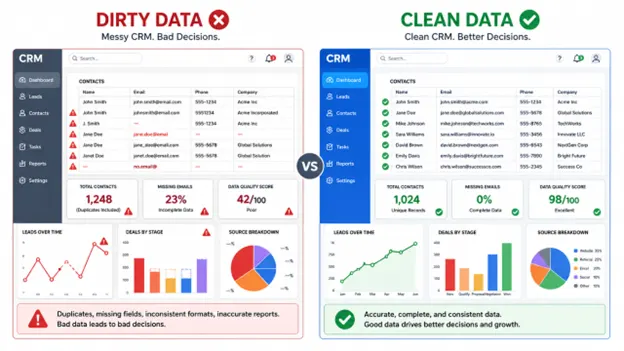
Every metric on this list is only as reliable as the data behind it. CRM research consistently shows that 76% of CRM entries are less than half complete. If that’s your data environment, your pipeline velocity calculation is wrong, your forecast is fiction, and your LTV:CAC ratio is based on guesswork.
Data quality score measures CRM completeness, accuracy, freshness, and deduplication across critical fields. Target: 90%+ completeness on required fields, under 5% duplicate rate, under 5% bounce rate on email addresses.
This isn’t glamorous RevOps work. But it’s foundational. A beautiful dashboard built on dirty data is confidence-inspiring in the short term and catastrophically misleading in the long term.
Ready to turn metrics into action?
The best RevOps dashboards aren’t comprehensive. They’re layered.
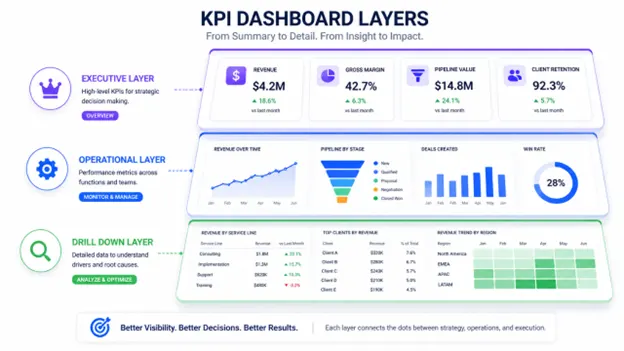
Executive layer (4 numbers, checked weekly): Pipeline coverage ratio, win rate, forecast accuracy, and NRR. These four tell the C-suite whether the revenue engine is healthy or broken. Everything else is context.
Operational layer (8-12 KPIs, reviewed weekly by RevOps): Add pipeline velocity, LTV:CAC, lead-to-opportunity conversion by source, sales cycle length by segment, data quality score, and CAC by channel. This is where RevOps spots trends before they become problems.
Drill-down layer (segmented by rep, service line, client size, source): This is where you investigate. When a metric moves, you come here to understand why.
The discipline is resisting the urge to add. Every metric added to the executive view dilutes the ones that matter. Leadership will always find the one metric that confirms what they already believe. Make sure the metrics that actually predict the future are impossible to miss.
Most RevOps content tells you what to track. Fewer pieces tell you what to do when the numbers move.
That’s where RevOps earns its seat at the table: not by reporting that pipeline velocity dropped 15% last quarter, but by having already diagnosed why (longer sales cycles in one service line due to a scope clarity problem in proposals) and having a cross-functional fix in motion before leadership even asks the question.
If ownership is still unclear internally, it may be time to hire your first RevOps leader.
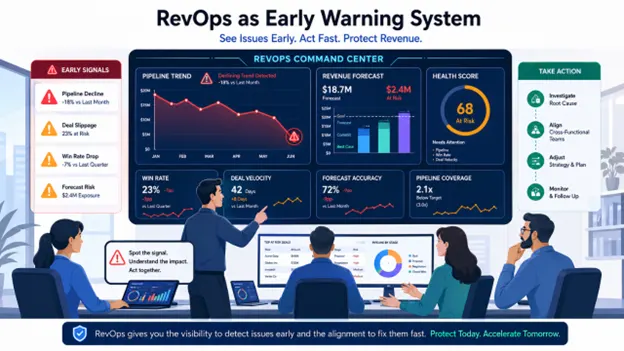
The metrics aren’t the strategy. They’re the early warning system. What you do with the warning is what separates RevOps teams that get budget from RevOps teams that get restructured.
Build the dashboard. Trust the data. But never confuse measurement with management. The KPIs are just the beginning of the conversation.
For a broader framework beyond metrics, read the complete guide to B2B revenue operations.
Looking to build a RevOps measurement framework that your exec team actually uses? Start by auditing your current pipeline data quality. Everything downstream depends on it.
Want a RevOps framework your leadership team will actually use?
The most important RevOps KPIs usually include pipeline velocity, win rate, pipeline coverage ratio, forecast accuracy, CAC to LTV ratio, net revenue retention, and conversion rates across funnel stages. These metrics connect revenue activity to business outcomes.
A strong RevOps dashboard should prioritize clarity over volume. Executive dashboards often work best with 4 to 6 core metrics, while operational dashboards may include 8 to 12 supporting KPIs. Too many metrics usually creates noise.
Sales metrics focus on sales team performance, such as quota attainment or close rate. RevOps metrics span the full revenue engine, including marketing efficiency, sales execution, customer retention, forecasting, and operational alignment.
If teams still operate in silos, this breakdown of Sales Ops vs Marketing Ops vs RevOps clarifies ownership.
Pipeline velocity shows how quickly opportunities convert into revenue. It combines deal volume, average value, win rate, and sales cycle length, making it one of the clearest indicators of funnel efficiency.
There is no universal benchmark. Many companies aim for 3x pipeline coverage, but service-based businesses with longer sales cycles may need 4x to 6x depending on win rates and deal timing.
RevOps improves forecast accuracy by enforcing CRM hygiene, standardizing stage definitions, validating buyer intent signals, and removing stalled or low-quality opportunities from forecasts.
Track What Actually Drives Revenue
Focus on the right RevOps KPIs to align teams, improve performance, and make smarter, data-driven decisions.