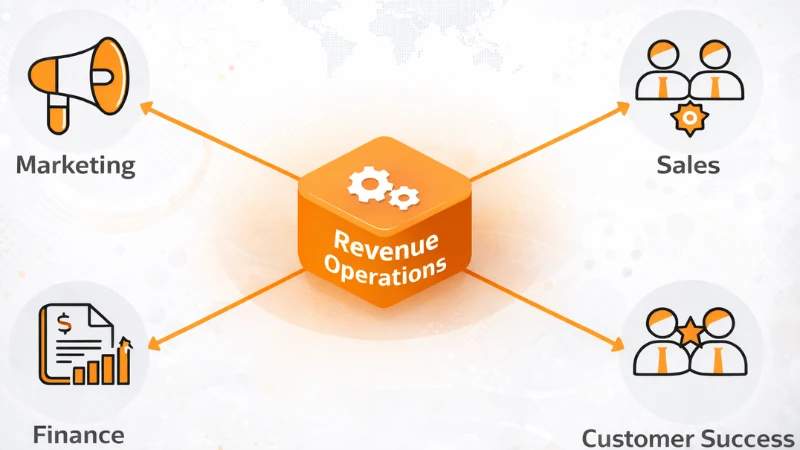
Turn Dashboards into Decisions
Build RevOps dashboards your team actually uses focused on the right metrics, real insights, and faster decision-making.
![]() Lead-Gen now on Auto-Pilot with
Build My Campaign
Lead-Gen now on Auto-Pilot with
Build My Campaign
How RevOps dashboards turn data into actionable insights, helping teams track performance, align goals, and drive smarter revenue decisions.

Turn Dashboards into Decisions
Build RevOps dashboards your team actually uses focused on the right metrics, real insights, and faster decision-making.
Your CRO uses two dashboards. Your VP of Marketing built a rogue Google Sheet. The CEO still asks for the same Monday report by hand. This is a system problem, not a data problem.
Let’s start with a truth that is a bit uncomfortable. Most RevOps teams are excellent at building dashboards and terrible at making them matter. You’ve got 40 views in Salesforce, a Looker instance that someone configured two reorgs ago, and a pipeline report that three people interpret three different ways in the same meeting. The problem isn’t your tools. It’s that you’re reporting activity when executives need outcomes, and you’re reporting outcomes when reps need to know what to do next Tuesday.
The fix isn’t a better BI tool. It’s understanding who reads what, what question each number answers, and crucially: what you want someone to do differently because they saw it. That last part is where most dashboards completely fall apart.
A dashboard nobody acts on isn’t a reporting problem. It’s wallpaper with a Salesforce login.Learn how modern revenue teams build RevOps systems that turn reporting into real growth decisions.
Before you open a single report builder, you need alignment on what you’re measuring. There are exactly seven KPIs that cover the full revenue lifecycle. Once these are nailed, you earn the right to add more. Until then, everything else is noise.
1. Pipeline Velocity
(Opps × Win Rate × Deal Size) / Cycle Length. The single best predictor of future revenue. Flat velocity + headcount growth = something is broken.
Turn Dashboards into Decisions
Build RevOps dashboards your team actually uses focused on the right metrics, real insights, and faster decision-making.
2. Forecast Accuracy
Week 1 forecast vs actuals at close. <10% variance = excellent. 20–30% = average. Above 30% means your pipeline data is fiction.
3. Win Rate
Watch the trend, not the absolute. Sliding from 30% to 22% over three quarters is a signal. A declining slope beats a static benchmark every time.
4. Sales Cycle Length
Segment by deal size. A $10k deal and a $200k deal averaged together tells you exactly nothing useful.
5. CAC Payback
Healthy: 12–18 months. Over 24 months: problem. Under 6 months: you’re probably underpricing. Both ends need attention.
6. Net Revenue Retention
NRR above 120%: your customer base grows without new logos. Below 100%: you’re leaking faster than you’re filling. This is your health check.
7. Quota Attainment
The distribution matters more than the average. 30% crushing it while 70% miss isn’t the same problem as an even 60%, even if the blended number looks the same.
One thing most RevOps reporting guides skip: these KPIs don’t live in isolation. Pipeline velocity is downstream of lead quality and speed-to-lead. CAC payback is shaped by what marketing spends to generate leads in the first place. Which brings us to the piece that’s almost always missing from reporting conversations.
Every RevOps reporting framework eventually talks about pipeline. Almost none of them connect it back far enough. Your pipeline numbers don’t start when an opportunity is created. They start the moment a lead enters the system. And if your lead management process is leaky, no amount of mid-funnel dashboard optimization fixes it.

Here’s what the funnel actually looks like when you connect lead management to revenue outcomes:
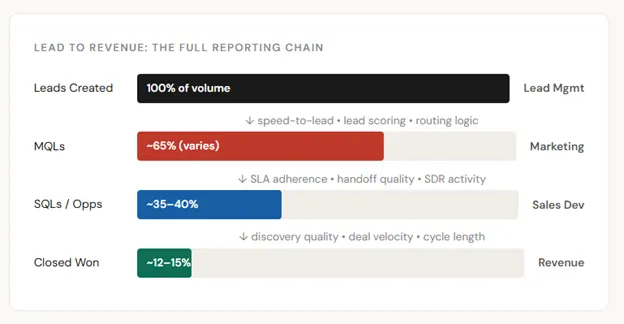
The leading indicators that most RevOps dashboards completely ignore: speed-to-lead (response time on inbound), lead routing accuracy (right lead to right rep), SLA adherence between marketing and sales, and MQL-to-SQL conversion by source. These aren’t vanity metrics. They’re the canary in the coal mine for your pipeline six to eight weeks from now.
Signal, not noise
If your MQL-to-SQL conversion is declining, your win rate problem is already baked in. You just won’t see it in the pipeline report for another month. Lead management reporting is your early warning system.
Track: speed-to-lead by source, lead routing SLA compliance, conversion rate by channel, and disqualification reason codes. These four numbers explain more of your pipeline health than most stage conversion reports.
The biggest dashboard mistake isn’t using the wrong tool. It’s building one view and expecting it to serve everyone. Your CRO and your SDRs have nothing in common in terms of what they need to see, how often, or what action they should take from the data.
| Audience | Core Question | Key Metrics | Refresh | Format Rule |
| Executive (CEO, CRO, Board) | Are we on track? | Revenue vs plan, NRR, forecast accuracy, CAC payback, pipeline coverage | Weekly | 5–7 metrics, one screen. Trend lines. Red/amber/green. 30-second read. |
| Manager (VP Sales, VP Mktg) | Why is this happening? | Pipeline by rep, stage conversion, deals at risk, activity vs benchmarks | Daily–weekly | Interactive filters. Drill-down capability. They need to slice it themselves. |
| IC (Rep, SDR, CSM) | What do I do today? | Personal pipeline, activities, deal health, lead SLA status, next best action | Real-time or daily | Personal scorecard. Focus on what they control. CAC payback is not their problem. |
This sounds obvious, and yet. The most common RevOps reporting failure mode is the “comprehensive” dashboard that technically has everything and practically serves no one. If a rep has to scroll through executive-level ARR charts to find their personal pipeline, you’ve built friction into the one tool that’s supposed to help them close deals.
None of this works if your data is bad. And a gorgeous, gorgeous dashboard built on bad data is worse than an ugly one built on clean data, because the beautiful one actually gets trusted. There are four data quality problems that quietly destroy RevOps reporting credibility:
The four killers
The lead management connection is relevant here too. Bad lead routing creates duplicate records. Unclear MQL definitions create inconsistent conversion tracking. The data quality problem almost always starts upstream of the pipeline, in the lead management layer where the rigor is lowest and the ownership is least clear.
The pipeline review is the most important recurring meeting in most revenue organizations. It’s also the most commonly mis-run one. Here’s a format that takes 20–25 minutes and produces actual decisions:
Here’s the test for whether your dashboard is actually working. It’s not whether people look at it. It’s whether people do something different because of it.
Every metric needs a pre-defined response protocol. Not “we’ll figure it out when it happens.” Defined in advance, before the number moves, so the decision is already made and execution can start immediately.
| Metric | Trigger | Response | Owner |
| Win Rate | Falls below threshold | Trigger deal review process, competitive analysis, discovery quality audit | VP Sales + RevOps |
| Pipeline Coverage | Below 3x | Increase outbound activity targets, audit lead routing SLAs, escalate to CRO | SDR Manager + RevOps |
| Forecast Variance | Exceeds 20% | Audit pipeline with frontline managers, tighten stage exit criteria, clean stale opps | RevOps |
| Speed-to-Lead | SLA breach | Review routing rules, identify rep capacity issues, escalate to SDR leadership | Lead Mgmt + SDR Ops |
| MQL-to-SQL Conversion | Declining trend | Review MQL definition, audit source quality, joint marketing/sales review | Marketing Ops + RevOps |
| NRR | Falls below 100% | Immediate CS executive review, churn cohort analysis, expansion playbook activation | CS Leadership + RevOps |
Without defined responses, dashboards are decoration. With them, they become the operating system your revenue org runs on. This is the part no one builds, and it’s the most important part.
Audit this quarterly
Reports nobody uses are waste. Every quarter, audit your dashboard usage. If a view hasn’t been opened in 30 days by anyone except the person who built it, retire it. Your CRM isn’t a museum. Kill the shelfware.
The RevOps teams that build reporting people actually use, share one habit: they start with the decision, not the data. What do you need to decide? Who decides it? How often? What would make you act differently? Build backward from those answers, and you’ll build something worth looking at.
Connect it to your lead management process, and you’ll stop explaining pipeline problems after they’ve already cost you the quarter. The leads that enter your system today become the pipeline that misses (or hits) your number six weeks from now. The earlier your reporting catches the signal, the more runway you have to do something about it.
Stop building dashboards because someone asked for visibility. Build them because you know exactly what decision they enable and what action follows when the number moves. That’s the difference between RevOps reporting and a very expensive wall of charts.
Turn Dashboards into Decisions
Build RevOps dashboards your team actually uses focused on the right metrics, real insights, and faster decision-making.