Turn Pipeline Velocity Into Predictable Revenue
See where deals are slowing, which levers need attention, and how Valasys helps you accelerate high-quality opportunities into faster wins.
![]() Lead-Gen now on Auto-Pilot with
Build My Campaign
Lead-Gen now on Auto-Pilot with
Build My Campaign
Learn how to measure pipeline velocity and improve it to accelerate sales cycles, boost conversions, and drive faster revenue growth.
Turn Pipeline Velocity Into Predictable Revenue
See where deals are slowing, which levers need attention, and how Valasys helps you accelerate high-quality opportunities into faster wins.
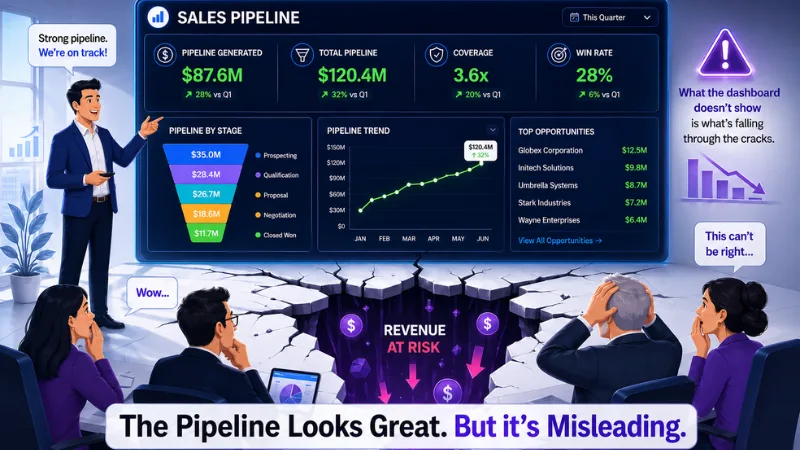
Here’s the thing about traditional pipeline reviews: they’re optimistic by design. Sales leaders look at total pipeline value. Reps keep deals open because hope feels better than updating a CRM. And the result is a dashboard full of numbers that look healthy until the quarter ends and reality arrives, uninvited.
| 80%
of sales orgs miss forecast by more than 5% |
22%
longer B2B sales cycles since 2022 |
| 19%
median B2B win rate in 2024, down from 23% |
11x
velocity gap between top and bottom performing teams |
That 11x gap is worth sitting with. Top-performing sales teams don’t just win more deals. They’ve built compounding structural advantages across all four inputs simultaneously. A 10% improvement in each lever doesn’t produce 40% more velocity, it produces roughly 46% more, because the formula multiplies. That’s the math working in your favor, or against you, depending on which side of the gap you’re on.
Deals that have exceeded their expected close date convert at 23%. Deals that close within the average cycle length convert at 68%. That 45-point gap is one of the most actionable signals in your entire pipeline, and most sales managers never look at it.
Turn Pipeline Velocity Into Predictable Revenue
See where deals are slowing, which levers need attention, and how Valasys helps you accelerate high-quality opportunities into faster wins.
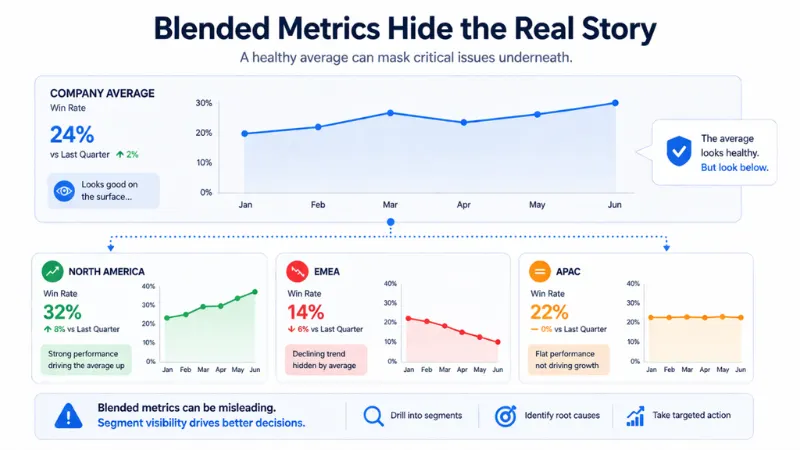
Blended metrics are where pipelines go to hide. One region accelerates while another stalls. SMB volume masking a collapsing enterprise segment. Inbound leads closing at 40% while outbound scrapes 12%. A single company-wide average smooths all of that into one number that implies things are fine. They’re not always fine.
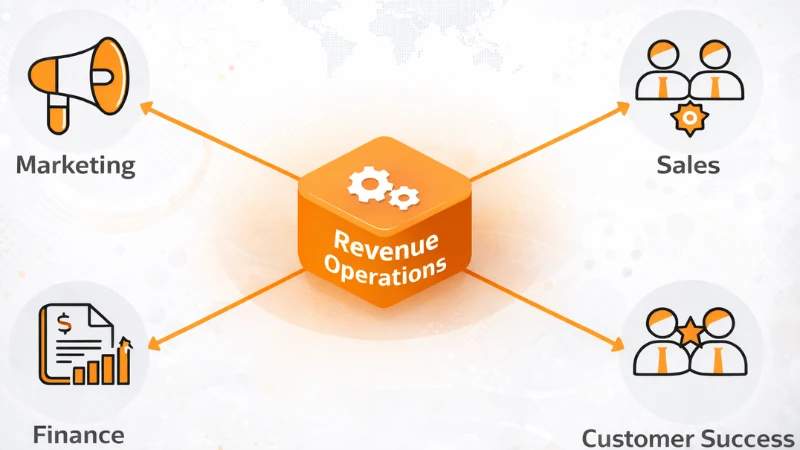
For a deeper look at how Revenue Operations connects pipeline health to cross-functional performance, see our complete guide to RevOps for B2B marketers.
Each lever is a distinct diagnosis. If your velocity is dropping, you need to know which variable is causing it before you can fix it. Throwing coaching at a win rate problem when the real issue is deal size compression is a waste of everyone’s time. The formula forces specificity, that’s the point.
| 01
Qualified Opportunities Volume of real, ICP-matched deals. Not raw leads. Not wishful thinking. |
02
Deal Size Average contract value per closed-won deal. Silently compressed by discounting. |
| 03
Win Rate Percentage of qualified opps that close. A lagging indicator that hides upstream problems. |
04
Cycle Length Days from opportunity creation to close. Lengthened 22% across B2B since 2022. |
The number of opportunities in the formula needs to be qualified opportunities, not raw leads, not everyone your reps spoke to at a conference. Unqualified deals inflate your count, drag down your win rate, and make your sales cycle look longer than it actually is. Junk in, junk out. The metric only works when the inputs are honest.
Understanding Sales Ops vs. Marketing Ops vs. RevOps is essential here, each function owns different parts of these four levers, and misalignment between them is often where pipeline quality degrades first.
The standard advice is: more opportunities, bigger deals, higher win rates, shorter cycles. Yes. Obviously. Here’s how to actually do it at the sales management level, where the real levers live.
01 Track velocity by segment, rep, and deal source, weekly
Not monthly. A blended company average reviewed monthly tells you nothing actionable. Inbound from marketing closes differently than outbound. Enterprise has a different cycle than SMB. You need to see where the momentum is actually breaking down.
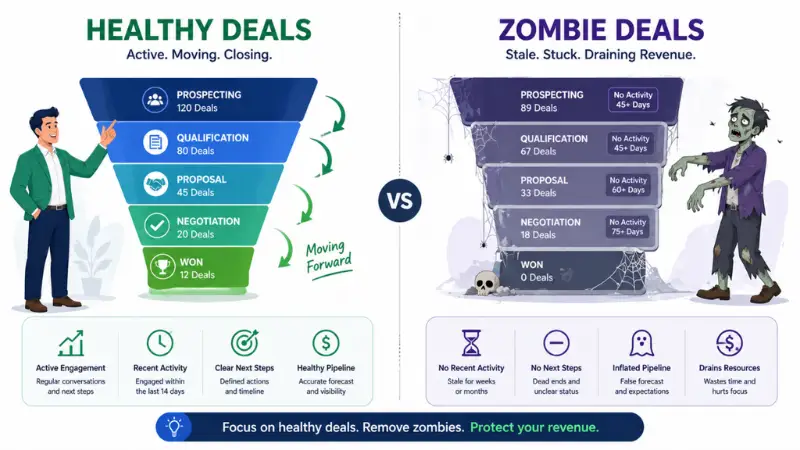
02 Kill zombie deals with a deadline, not a conversation
Any deal past its expected close date by more than 30 days needs a defined “last contact” play or gets moved to closed-lost. Letting it sit gives reps false hope and leadership false coverage. Both are damaging.
03 Fix lead quality before fixing sales coaching
If win rates are sliding, check pipeline source mix before assuming execution is the problem. A shift from inbound to outbound, or from partner referrals to cold outreach, can drop the blended win rate by 10 points with zero change in rep quality.
04 Use mutual close plans to compress cycle length
A typical B2B buying decision now involves six to ten stakeholders. Without a shared timeline and agreed milestones, deals drift. A mutual close plan gives the buyer a structure to work within and the rep an excuse to follow up.
05 Stop letting deal size compression happen silently

Discounting is often invisible in pipeline reviews until it shows up in revenue attainment. Track average deal size as a trend line, not a snapshot. If it’s declining faster than the market average, that’s a pricing or positioning problem.
06 Identify your highest-velocity lead sources and invest in them
Not all opportunities are equal. If referrals from existing customers close in 20 days at a 55% win rate, and cold outbound closes in 80 days at 8%, the right move isn’t to “work the outbound harder”, it’s to get more referrals.
07 Use AI to surface stalled deals before they become losses
Modern sales management platforms can flag deals without meaningful engagement in 10–14 days, deals where stakeholder engagement has dropped off, or deals that share characteristics with historical losses. This isn’t replacing sales judgment, it’s replacing the manual work of doing pipeline hygiene by memory.
Organizations that track pipeline velocity weekly achieve 34% annual revenue growth versus 11% for irregular trackers. That’s not a coincidence. Weekly visibility creates the cadence to catch problems before they become misses.
“A 10% improvement in each variable yields roughly a 46% increase in total velocity. The math isn’t linear. It’s compounding. That’s the game.”
For a practical look at how to surface these signals in your reporting stack, read our guide on RevOps reporting dashboards that drive decisions.
Sales AI is not magic. But it does solve a very specific, very expensive problem: the gap between what’s happening in a deal and what’s recorded in the CRM. Reps don’t update deal status consistently. Meeting notes don’t get logged. Stakeholder changes go untracked. All of that invisibility is velocity leakage.
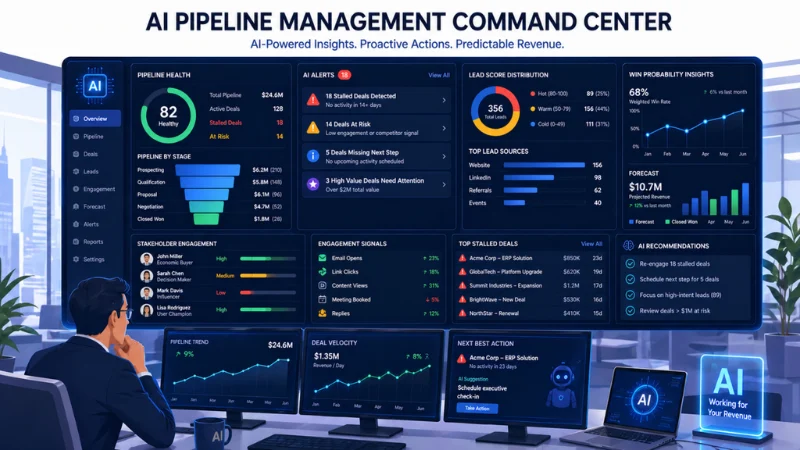
AI-powered sales management tools now do several things that directly impact each lever. They enrich CRM data automatically, reducing the time reps spend on administrative work and improving the accuracy of your pipeline snapshot. They score leads based on ICP fit and historical win patterns, which improves the quality of your qualified opportunity count. At-risk deals are flagged in real time. And they generate follow-up content that reduces the manual friction slowing down your sales cycle.
None of this replaces the judgment call a good sales manager makes in a 1:1. But it removes the data problems that make those judgment calls harder than they need to be. Clean data, clear signals, faster cycles.
Choosing the right tools is itself a RevOps decision. Our breakdown of the B2B revenue tech stack covers how to evaluate and layer AI tools without creating more complexity than you solve.
Pipeline velocity isn’t just a retrospective metric, it’s a forward-looking one. If your velocity is $2,000 per day and it’s been dropping 5% week-over-week for three weeks, you don’t need to wait until the quarter ends to know you have a problem. You already have a problem. Act now.
When velocity drops 15% below your trailing four-quarter average, that’s the threshold where most organizations will miss the quarter unless something material changes. That number gives you time to diagnose and respond, rather than explain at board review why the coverage ratio looked fine and the quarter still came in short.
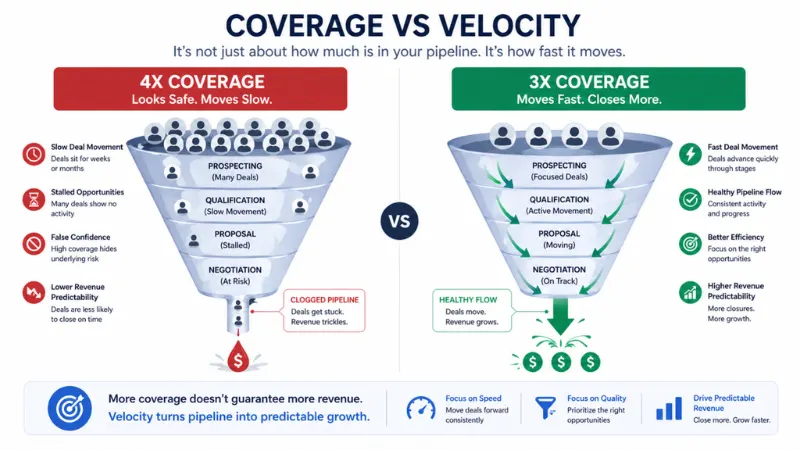
Pipeline coverage ≠ pipeline velocity. Coverage is volume. Velocity is flow. A 4x coverage ratio with decelerating velocity is worse than 3x coverage with accelerating velocity. That distinction should live at the center of every pipeline review.
If you’re thinking about who should own this forecasting function, our piece on when and how to hire your first RevOps leader is worth a read as is the RevOps approach to sales and marketing alignment, which underpins accurate forecasting at scale.
1. What is pipeline velocity in sales?
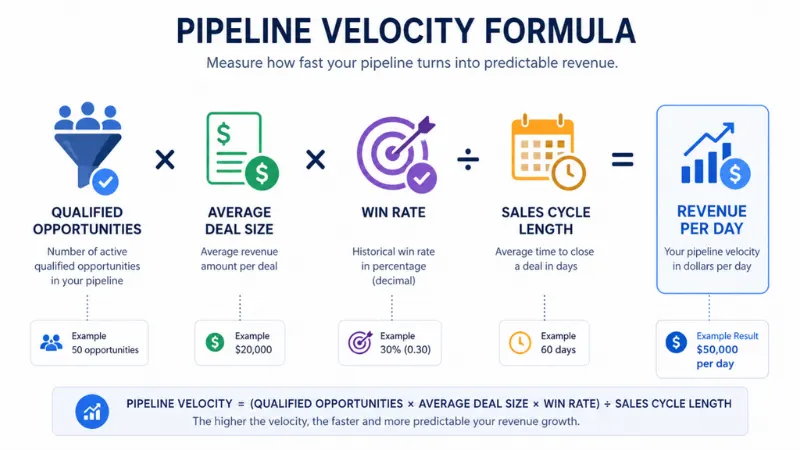
Pipeline velocity is a metric that measures how much revenue your pipeline generates per day. It’s calculated by multiplying qualified opportunities, average deal size, and win rate, then dividing by the average sales cycle length in days. The result tells you how fast your pipeline is converting into closed revenue, not just how large it is.
2. What is the pipeline velocity formula?
Pipeline Velocity = (Number of Qualified Opportunities × Average Deal Size × Win Rate) ÷ Average Sales Cycle Length in Days. For example: 50 opportunities × $8,000 deal size × 20% win rate ÷ 40 days = $2,000 per day in expected revenue flow.
3. What is a good pipeline velocity?
There is no universal benchmark because pipeline velocity depends on deal size, cycle length, and win rate, all of which vary by industry and business model. The benchmark that matters is your own. Track your trailing four-quarter average and treat a 15% drop below that average as a signal that the quarter is at risk.
4. How is pipeline velocity different from sales velocity?
They’re the same metric. Sales velocity, pipeline velocity, and deal velocity all refer to the same calculation using the same formula. The terms are used interchangeably across the industry. What matters is that you measure consistently, not which label you use.
5. How often should you measure pipeline velocity?
Weekly, broken out by segment, deal source, and rep. Organizations that track velocity weekly achieve 87% forecast accuracy compared to 52% for those who track irregularly. A monthly blended average hides too much. Weekly segment-level tracking surfaces problems while you can still do something about them.
6. What causes pipeline velocity to decrease?
Any of the four inputs can cause a drop: fewer qualified opportunities (a demand generation or qualification problem), declining average deal size (a discounting or positioning problem), falling win rates (a lead quality, sales execution, or product-market fit problem), or lengthening sales cycles (a buyer complexity or internal process problem). Diagnosing which lever is moving before choosing a response is essential.
Turn Pipeline Velocity Into Predictable Revenue
See where deals are slowing, which levers need attention, and how Valasys helps you accelerate high-quality opportunities into faster wins.