Generate More B2B Leads With Webinars
Get proven strategies, templates, and tactics to generate qualified B2B leads through high-converting webinars.
![]() Lead-Gen now on Auto-Pilot with
Build My Campaign
Lead-Gen now on Auto-Pilot with
Build My Campaign
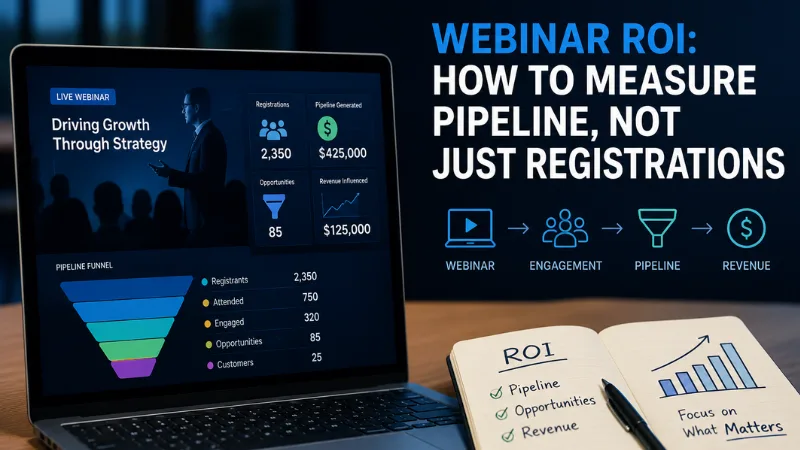
Learn how to measure webinar ROI by tracking pipeline impact, revenue contribution, and qualified opportunities beyond registrations.
Generate More B2B Leads With Webinars
Get proven strategies, templates, and tactics to generate qualified B2B leads through high-converting webinars.
Getting webinar registrations is a lot like getting matches on a dating app.
It feels great. The numbers look impressive. Teams celebrate hitting registration goals and dashboards light up with positive results.
But matches are not relationships. And registrations are not pipeline.
What matters is what happens after that first expression of interest. Did they engage with the conversation? Did they come back? Did they take the next step? Did they eventually become a customer?
The same logic applies to webinars. A registration tells you someone was interested enough to sign up. It does not tell you whether they were a good fit, whether they showed buying intent, or whether they influenced revenue.
Yet many webinar reports stop there. They focus on registrations, attendance rates, and engagement scores while overlooking the metrics leadership actually cares about: opportunities created, pipeline influenced, and revenue generated.
The teams that consistently prove webinar ROI understand a simple truth: registrations are the beginning of the story, not the ending.
Generate More B2B Leads With Webinars
Get proven strategies, templates, and tactics to generate qualified B2B leads through high-converting webinars.
This blog explores how to measure webinar ROI the way revenue teams do by tracking the journey from attendee engagement to pipeline impact.
Need a clearer way to connect webinar engagement to revenue?
Registrations show that someone found your webinar interesting enough to sign up. That is a useful early signal. But it is not proof of business impact.
The challenge in B2B is that buying decisions are not made by individuals. They are made by legitimate buying committees. A single registration from a target account does not tell you whether the economic buyer saw your message, whether the champion is building internal consensus, or whether your competitor already has that account under evaluation.
Research found that the average B2B buying group includes more than 10 people, yet the average form-fill rate across buyer journeys is just 3.7%. That means the vast majority of buying-group members are researching your solution without ever raising their hand.
The same research shows that 81% of buyers select a preferred vendor before speaking with sales. By the time someone registers for your webinar, the decision-making process inside their organization may already be well underway.
Webinar attendance and engagement metrics matter as early indicators. But treating them as the final measure of success is where most webinar reporting breaks down.
Webinar ROI measures the business return generated from a webinar compared to the total cost of producing, promoting, running, and following up on it. In B2B marketing, that return is most meaningfully expressed through pipeline value and closed-won revenue.
| Webinar ROI = [(Revenue or Pipeline Value Generated – Total Webinar Cost) / Total Webinar Cost] x 100 |
In practice, webinar ROI in B2B is rarely captured in a single calculation. The full picture builds in stages:
Each stage tells you something different. Used together, they give you a complete picture of the webinar’s contribution to the business.
To move beyond surface metrics, we use the PIPE Framework for Webinar ROI. This four-stage model connects audience quality, behavioral signals, pipeline outcomes, and financial efficiency into a single reporting structure.
PIPE stands for: Presence, Intent, Pipeline, and Economics.
Five hundred random registrations are worth less than fifty high-fit target accounts. Presence is not about volume. It is about whether you reached the accounts and personas most likely to buy.
The metrics that matter here include:
If your webinar on enterprise security attracted 400 registrations but only 12 matched your ideal customer profile, the ROI story will be hard to tell. Start with presence to understand whether the rest of your metrics have a foundation worth building on.
Passive attendance is not a buying signal. Someone who joins a webinar and multitasks for 20 minutes is not the same as someone who watched for 55 minutes, asked two questions, clicked your demo CTA, and came back to watch the on-demand version three days later.
Intent metrics tell you which attendees are actually engaged, and which ones are worth prioritizing for sales follow-up. Key intent signals include:
ON24 reported an average webinar engagement time of 49 minutes. Their benchmarks also show that on-demand content continues to capture a significant share of webinar views, with 52% of total attendees watching on-demand rather than live.
This is where webinar ROI becomes real. Pipeline is the bridge between marketing activity and revenue outcome, and it is what leadership cares about most.
There are three types of webinar pipeline contribution to track:
The pipeline metrics to report include:
If your CRM is not capturing webinar touchpoints at the opportunity and contact level, you will not be able to tell this story. That is a workflow problem before it is a reporting problem.

Once you understand what the webinar produced, you need to know what it cost. Every webinar has a real cost that goes beyond the platform fee.
Total webinar cost typically includes:
The efficiency metrics to track alongside cost include:
Two webinars can have the same attendance rate and produce completely different pipeline efficiency. The Economics layer tells you which programs are genuinely worth scaling.
The webinar success metrics that matter most beyond registrations are ICP attendance, engagement depth, CTA activity, MQL conversion, meetings booked, opportunity creation, influenced pipeline, closed-won revenue, and cost per qualified opportunity.
Here is a brief breakdown of each:
Connecting webinar activity to CRM records is the operational step most teams skip, and it is exactly why so many webinar reports stop at attendance.
Here is a practical process for building webinar-to-pipeline tracking:
Benchmarks for webinar performance vary significantly by industry, audience size, topic specificity, and whether the event is live or on-demand. There is no single number that defines success.
An industry analysis of 19,531 webinars across 418 B2B brands found an average live attendance rate of 33%, which means a realistic target for most programs is somewhere between 30% and 40% of registered attendees showing up live.
Another report says 60% registration-to-attendee conversion as a total attendee conversion metric when combining live and on-demand views over the full content lifecycle.
One more Webinar Benchmark Report found that 69.4% of marketers plan webinars specifically for pipeline generation, confirming that pipeline is now a primary objective rather than a secondary outcome.
A good webinar is not always the one with the most registrations. It is the one that attracts the right accounts, produces strong engagement signals, creates sales conversations, and contributes measurable pipeline. A 200-person webinar with 40 ICP-fit accounts and 12 meetings booked outperforms a 1,000-person webinar with no CRM attribution and a 0% MQL conversion rate.
Most webinar reports are optimistic by default. These are the patterns that inflate the numbers without improving the business:
A well-structured webinar ROI report does not just document what happened. It demonstrates business impact and surfaces lessons for the next event.
Your report should include:
Ready to measure webinar ROI by pipeline, not just sign-ups?
Webinars should not be reported like isolated events. They should be measured like revenue programs.
Registrations show reach. Attendance shows interest. Engagement shows intent. But the pipeline shows business impact. The teams that consistently win with webinars are the ones that connect audience quality, behavioral signals, CRM attribution, sales follow-up velocity, and revenue outcomes into a single coherent story.
The PIPE Framework gives you a structure to do that: Presence tells you who you reached, Intent tells you who engaged, Pipeline tells you what was created or influenced, and Economics tells you whether it was worth the investment.
Webinar ROI is not a single number. It is a narrative that runs from the first registration to the last closed-won deal. The teams that tell that story well are the ones that earn the budget to keep running webinars.
Webinar ROI is the business return generated from a webinar compared to the total cost of producing, promoting, and running it. In B2B, ROI is most meaningfully measured through pipeline value created or influenced by the event and the closed-won revenue that can be attributed back to it. The formula is: [(Pipeline or revenue generated – Total cost) / Total cost] x 100.
Measuring webinar ROI requires tracking outcomes at multiple stages: audience quality (presence), behavioral engagement (intent), pipeline contribution (opportunities created, influenced, and accelerated), and cost efficiency (economics). You need to sync webinar engagement data to your CRM, attribute touchpoints to campaigns and contacts, and report pipeline value alongside cost metrics.
The most important metrics beyond registrations are ICP-fit attendance, engagement depth (watch time, questions, CTA clicks), MQL conversion rate, meetings booked, opportunities created or influenced, pipeline value, closed-won revenue with webinar attribution, and cost per qualified opportunity. These metrics connect the event to business outcomes.
Webinar-sourced pipeline includes opportunities that were created directly from leads who first engaged through the webinar. Webinar-influenced pipeline includes existing opportunities where a webinar touchpoint was part of the buyer’s journey but was not the originating source. Both matter for a complete ROI picture, but they should be tracked separately in your CRM.
Yes. On-demand viewers often account for a significant share of total engagement, and their viewing behavior can be just as intent-rich as live attendance. Track on-demand view duration, CTA activity, and any subsequent actions the same way you track live attendees. Attribution windows should be extended to capture on-demand engagement over at least 30 to 90 days post-event.
Most B2B teams use a 30 to 90 days attribution window for webinar pipeline, though complex enterprise deals may warrant longer windows. The window should reflect your average sales cycle length. Define the window clearly with your sales and RevOps teams before the event, so pipeline reporting is consistent and comparable across programs.
Generate More B2B Leads With Webinars
Get proven strategies, templates, and tactics to generate qualified B2B leads through high-converting webinars.