Revenue Driven Nurture Performance Metrics Guide
Measure pipeline impact instead of email open rates
![]() Lead-Gen now on Auto-Pilot with
Build My Campaign
Lead-Gen now on Auto-Pilot with
Build My Campaign
Open rates are dead; pipeline isn't. Stop chasing vanity metrics and learn to measure the B2B nurture data that actually drives revenue and deals.
Revenue Driven Nurture Performance Metrics Guide
Measure pipeline impact instead of email open rates
A no-BS guide to the metrics that actually move revenue in B2B email nurture.
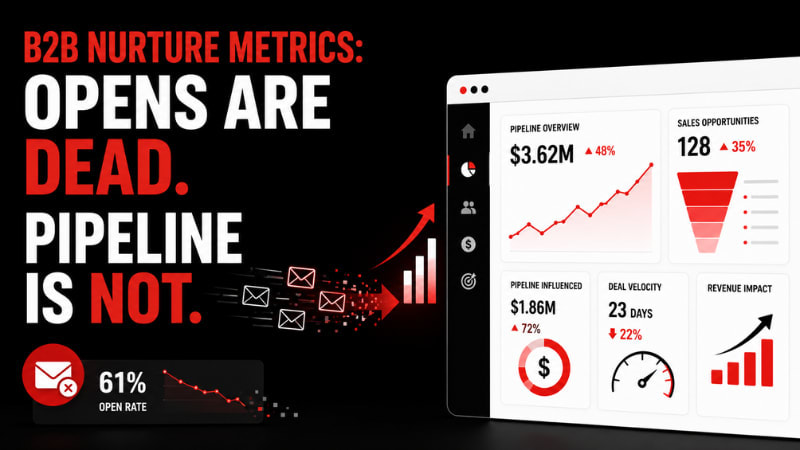
Your open rate just hit 61%. Champagne? Not yet.
That campaign generated almost zero revenue. Meanwhile, the one with a 27% open rate? $13,000. Numbers lie. Pipeline doesn’t.
Let’s get one thing straight: open rates aren’t dead. They’re just misunderstood. Badly. And if you’ve been optimizing your entire B2B nurture strategy around them, you’ve been racing the wrong car in the wrong direction on the wrong track.
This blog is your recalibration point. We’re going to rip apart the vanity metrics that keep marketers busy and broke, and rebuild your measurement framework around the only thing that actually matters: pipeline movement and closed revenue.
Buckle up. This one gets a little spicy.
If you want to see how we systematically re-engage stale prospects, read the B2B Email Nurture & Lead Reactivation Playbook first.
Revenue Driven Nurture Performance Metrics Guide
Measure pipeline impact instead of email open rates
Here’s the thing about open rates: they used to be a decent proxy for engagement. Then Apple dropped iOS 15’s Mail Privacy Protection, and the whole game changed. Every Apple Mail user now registers as “opened” the moment an email lands, whether they touched it or not.
Add in bot traffic from corporate firewalls that auto-click every link to scan for malware at 3 AM, and you’ve got a metric that’s about as reliable as asking your cat for sales forecasts.
The scale of this is wild: Apple held around 58% of global email client market share at the time of the iOS 15 update. That’s the majority of your list potentially ghost-opening your emails. Your 50% open rate might actually be a 15% open rate. Or it might be accurate. You genuinely don’t know.

But here’s the part most people miss: open rates are still directionally useful. Think of them as a Gallup poll, not a census. If you A/B test two subject lines and one pulls 40% vs another at 20%, you’ve learned something real, even if neither number is perfectly accurate. The gap tells the story. It’s not the measurement, it’s the signal.
Jay Schwedelson, one of the sharpest email marketers working today, says it perfectly:
Open rates act like a survey for marketing tactics. Use them to compare, not to report.
If we’re retiring open rates as the north star, we need something better. Here’s the framework we recommend for any serious B2B nurture program in 2026:
| Metric | What It Tells You | Why It Matters |
| Click-Through Rate | Real humans engaged with your content | Post-iOS15, clicks are the new opens |
| MQL to SQL Rate | How many cold leads turned warm | Directly tied to sales pipeline health |
| Pipeline Influenced Revenue | Revenue touched by nurture before close | The money metric. Full stop. |
| Deal Acceleration Rate | How fast nurtured deals close vs non-nurtured | Proves your nurture is working |
| Re-engagement Rate | Dormant leads reactivated by behavior triggers | Validates cold lead strategy |
| Champion Engagement Depth | Number of stakeholders engaging per account | B2B buys are committee decisions |
Notice what’s not in that table? Open rates. Not because they’re useless. But because they’re not your primary signal anymore.
One reason teams become obsessed with opens and clicks is that every metric gets treated as equally important. They are not.
The strongest nurture programs measure performance in layers, with each layer getting closer to revenue.
Layer 1: Engagement Metrics
These tell you whether people are paying attention.
Layer 2: Qualification Metrics
These show whether engagement is turning into buying intent.
Layer 3: Pipeline Metrics
These reveal whether nurture is generating real sales conversations.
Layer 4: Revenue Metrics
These are the metrics executives actually care about because they connect marketing activity directly to business outcomes.
The mistake many teams make is spending all their reporting time in Layer 1 while leadership is evaluating success in Layer 4. A healthy nurture program measures all four layers, but prioritizes the ones closest to revenue.
Imagine two nurture programs.
Program A generates a 52% open rate, a 4% click-through rate, and creates two opportunities.
Program B generates a 28% open rate, a 2.5% click-through rate, and creates twelve opportunities worth $180,000 in pipeline.
If you stop reporting at the engagement layer, Program A looks like the winner. The moment you move down the hierarchy toward pipeline and revenue, Program B becomes the obvious choice.
That is exactly why nurture metrics must be evaluated in context rather than isolation.
Here’s a scenario that plays out in B2B marketing teams every week. You’ve got a healthy list. You send to your most engaged segment, your 30-day openers, your loyalists. Open rates look great, 45%, 50%. Marketing loves it. Slides look good in the QBR. And then someone looks at the revenue report and asks the uncomfortable question: why aren’t we seeing more pipeline?
Because you’re emailing the same 30% of your list on repeat. Your most active subscribers can only buy so much. There’s a ceiling on how many deals you can close with people who are already your biggest fans. The money is hiding in the other 70%.
The fix isn’t to blast your entire list every time. That nukes your deliverability and gets you landed in spam faster than an unsolicited calendar invite. The fix is a campaign calendar rotation.
Think of it like a basketball team. You can’t win every game running the same play. Your hot segment is your star player. But you need the whole roster.
Stop guessing who is ready to buy. Use VAIS (Valasys AI Score) to pinpoint high-intent leads and prioritize your outreach based on real-time data and behavior.
If you’re sending 3 emails a week (12 per month), here’s how to structure the rotation:
| # Emails | Audience Tier | Segment | Expected Outcome |
| 10 | Warm/Active | 30, 60, or 90-day email openers | Consistent engagement + healthy sender reputation |
| 2 | Broad/Cold | 180-day Active on Site audience | Lower open rate BUT massive revenue spikes |
Those 2 broad sends will have lower open rates. That’s expected and fine. What they will do is unlock buyers who visited your site in the last 6 months but never converted. That’s where the revenue spikes come from.
Turn your MQLs into closed deals by following the full-funnel architecture. If your leads are stalling, deploy custom Email Nurture by Valasys. We build behavior-triggered, persona-based sequences that turn cold contacts into active pipeline.
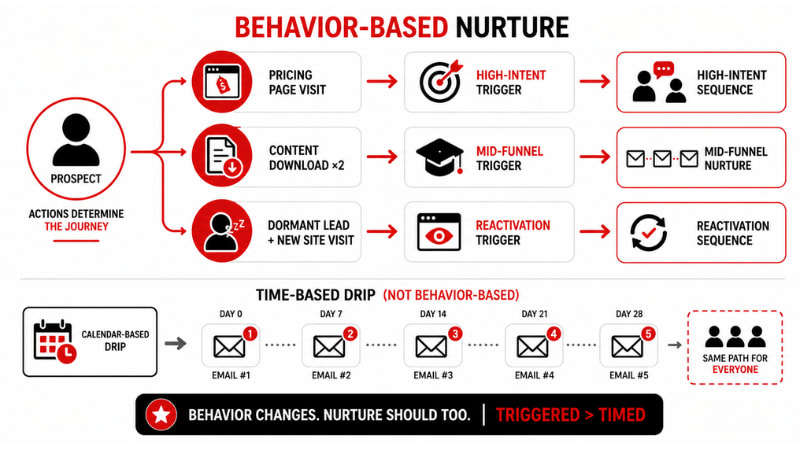
Metrics become far more useful when they are connected to behavior.
A prospect who opens three emails tells you very little. A prospect who visits your pricing page, downloads a case study, and attends a webinar tells you considerably more.
This is why modern nurture programs are increasingly built around behavioral signals rather than fixed calendars. Instead of measuring whether an email was opened, marketers can measure whether specific actions moved a prospect closer to a buying decision.
Some of the most valuable behavioral signals include:
| Behavior | Metric Impact |
| Pricing page visit | Higher MQL-to-SQL conversion |
| Product documentation engagement | Stronger sales qualification |
| Multiple asset downloads | Lead score growth |
| Webinar attendance | Opportunity creation |
| Return website visits after inactivity | Lead reactivation |
The real value of behavior-based nurture is not simply personalization. It is measurement precision. By connecting engagement signals to pipeline outcomes, marketers gain a much clearer understanding of which activities actually influence revenue.
This is also where pipeline-influenced revenue becomes incredibly valuable. Consider a typical buyer journey: a prospect downloads an ebook, enters a nurture sequence, attends a webinar, visits a pricing page, requests a demo, and eventually becomes a customer.
Looking at any single touchpoint in isolation tells only part of the story. Looking at the entire journey reveals how nurture contributed to pipeline creation and revenue generation. Instead of asking whether someone opened an email, marketers can ask whether nurture activities helped create opportunities, accelerate deals, or influence closed revenue.
That shift changes the entire purpose of reporting. The goal is no longer to measure activity. The goal is to measure business impact.
This is also where lead scoring becomes significantly more useful. Rather than assigning value to opens alone, modern scoring models prioritize actions that indicate buying intent and sales readiness.
The fundamental difference between behavior-based and time-based nurture is detailed in our guide, Behavior-Based Email Nurture vs Time-Based Drip. Think of time-based drips as a safety net, and behavior-driven sequences as your primary strategy.
Intent Signals Worth Tracking
If your lead scoring system isn’t capturing these signals, you’re measuring the wrong thing. See our breakdown of Lead Scoring in Email Nurture: What Sales Actually Needs[b] for what a real scoring framework looks like.
Knowing which metrics matter is useful. Knowing how to calculate them is what turns reporting into action.
Formula: SQLs ÷ MQLs × 100
Example: If 500 MQLs enter nurture and 75 become SQLs, your conversion rate is 15%.
This metric reveals whether nurture programs are successfully moving prospects toward sales readiness.
Formula: Opportunities Created ÷ Total Nurtured Leads × 100
This helps measure how efficiently nurture converts engagement into real pipeline conversations.

Formula: Total Opportunity Value Touched By Nurture
Unlike click rates or opens, this metric directly connects nurture activity to revenue-generating opportunities.
Formula: Average Days To Close For Nurtured Deals
Comparing nurtured versus non-nurtured opportunities often reveals whether nurture accelerates purchasing decisions.
These calculations help marketers move beyond engagement reporting and start measuring business outcomes.
One of the biggest mistakes marketers make is tracking metrics without context. A 10% conversion rate can be amazing in one program and terrible in another.
While benchmarks vary by industry, deal size, and sales cycle length, the ranges below provide a useful starting point for evaluating nurture performance.
| Metric | Healthy Range |
| Click-Through Rate (CTR) | 2%–5% |
| MQL-to-SQL Conversion | 10%–25% |
| Opportunity Creation Rate | 2%–10% |
| Lead Reactivation Rate | 5%–15% |
| Pipeline Influence Rate | 20%–50% of opportunities touched by nurture |
| Deal Velocity Improvement | 10%–30% faster than non-nurtured deals |
The important thing is not obsessing over the benchmark itself.
A company with a 12% MQL-to-SQL rate that improves to 18% in six months is creating far more value than a company sitting at 20% with no improvement.
Nurture measurement works best when benchmarks are treated as directional reference points rather than scorecards. The real goal is consistent movement toward stronger pipeline creation, faster deal progression, and higher revenue influence.
One reason nurture reporting often fails is that marketing and sales are measuring different realities.
Marketing celebrates email engagement. Sales cares about meetings, opportunities, and revenue.
Neither perspective is wrong, but both become incomplete when viewed in isolation.
A lead that marketing considers engaged may still be viewed by sales as unqualified. Likewise, a sales team may dismiss leads that are quietly building intent through repeated content consumption. Shared metrics create a common language, reducing the friction that often exists between lead generation and revenue teams.
The strongest revenue teams align around a shared set of metrics:
When both teams evaluate success using the same measurements, lead quality discussions become easier, handoffs improve, and pipeline forecasting becomes more reliable.
The goal is not better marketing reporting. The goal is better revenue visibility.
A CEO rarely asks about click-through rates. They ask whether marketing is creating a pipeline efficiently and whether that pipeline is converting into revenue.
While dozens of nurture metrics can be tracked, a handful consistently rise to the top in executive conversations because they reveal where growth is happening and where the funnel is leaking.
Together, these metrics provide a quick diagnostic of funnel performance. A rising CPL may indicate targeting inefficiencies or increased acquisition costs. Weak landing page conversion often points to a messaging or offer problem. A low MQL-to-SQL rate suggests that leads are entering nurture but not developing enough buying intent to engage with sales.
When reviewed together, these metrics help revenue teams identify bottlenecks faster and prioritize improvements that have the greatest impact on pipeline generation.
For a full walkthrough of building MQLs into SQLs, we’ve written the definitive guide: How to Nurture MQLs into SQLs.
Lead reactivation is often one of the most overlooked areas of nurture measurement.
Many organizations focus heavily on acquiring new leads while ignoring the value already sitting inside their database. The challenge is that reactivation success cannot be measured through opens alone.
Instead, marketers should track metrics such as:
The percentage of previously inactive contacts that re-engage through clicks, website visits, form fills, or replies.
The number of dormant leads that return and meet marketing qualification criteria.
The number of previously inactive contacts that demonstrate purchase intent and become sales-ready.
The total opportunity value generated from leads that were previously considered inactive.
Closed-won revenue that originated from re-engagement programs.
The most effective reactivation campaigns are not judged by email engagement alone. They are judged by whether dormant contacts re-enter the funnel and eventually contribute to pipeline growth.
We’ve got a whole playbook on How to Reactivate Cold B2B Leads Without Sounding Desperate. But the short version: don’t lead with “just checking in.” Lead with value.

| Segment | Build Criteria | Use For |
| 30-Day Openers | Can receive email + opened/clicked in last 30 days | High-frequency sends, flash offers |
| 60-90 Day Openers | Can receive email + opened/clicked in last 60-90 days | Re-engagement starts, product updates |
| 180-Day Site Active | Can receive email + active on site in last 180 days | Revenue spike campaigns, big announcements |
| SQL Behavioral | Visited pricing page OR requested demo OR downloaded 3+ assets | Sales handoff sequences |
| Cold Reactivation | No open/click in 90 days, but visited site in last 30 | Win-back sequences, value-first content |
For content syndication leads specifically, where engagement data is often limited, check out our targeted guide on Email Nurture Flows for Content Syndication Leads.
The B2B Nurture Dashboard Every Revenue Team Should Track
A dashboard overloaded with metrics creates confusion. A focused dashboard creates action.
For most B2B organizations, five metrics provide a reliable picture of nurture performance:
| Metric | Why It Matters |
| Click-Through Rate (CTR) | Measures genuine engagement |
| MQL-to-SQL Rate | Indicates lead quality and nurture effectiveness |
| Opportunity Creation Rate | Shows how often nurture generates sales conversations |
| Pipeline-Influenced Revenue | Connects nurture activity to pipeline growth |
| Deal Velocity | Measures how quickly nurtured opportunities close |
Together, these metrics create a complete measurement framework.
CTR tells you whether prospects are paying attention, but attention alone does not create revenue. MQL-to-SQL rate shows whether that engagement is translating into genuine buying intent, while opportunity creation rate reveals whether nurture is generating actual sales conversations.
From there, the focus shifts to business outcomes. Pipeline-influenced revenue helps quantify the impact nurture has on growth, and deal velocity shows whether those nurtured opportunities are moving through the funnel faster than they otherwise would.
Viewed together, these metrics make it easier to pinpoint exactly where performance is improving and where it is breaking down. A nurture program that produces lower open rates but higher pipeline is succeeding. A nurture program that generates plenty of engagement but fails to create opportunities is not.
That distinction is what separates revenue-focused measurement from vanity reporting.
Open rates didn’t die. They just got demoted. They’re a junior metric now, useful for testing and direction-setting, useless as a success story.
The marketers winning in B2B right now are the ones who’ve built nurture programs around behavior, pipeline stage, and revenue influence. They’re testing every send. They’re rotating across audience tiers. They’re measuring what actually moves deals, not what looks good on a weekly report.
And the irony? Their open rates are probably lower. Their pipeline is definitely higher.
Start small. Pick one metric from the table above that you’re not currently tracking. Build the segment. Run the test. See what the pipeline says.
Because in B2B, the only scoreboard that matters is the one with dollar signs on it.
No. They’re useless as an absolute number. They’re still highly useful as a directional metric. Use them for A/B testing subject lines and comparing relative performance. Don’t use them to report campaign success to leadership.
Click-through rate is the immediate swap. But the real upgrade is pipeline-influenced revenue: the total deal value that touched your nurture program before closing.
Send an email at 3 AM. Any clicks in the first 30 minutes are almost certainly automated security bots. Calculate that percentage and apply it as a discount to your overall CTR reporting.
If you’re currently relying on open rates, start with click-through rate. Once that reporting is established, move toward MQL-to-SQL conversion and pipeline-influenced revenue. The goal is to gradually connect engagement metrics to business outcomes rather than replacing everything at once.
An MQL (Marketing Qualified Lead) has shown interest in your content, downloaded something, attended a webinar. An SQL (Sales Qualified Lead) is actively evaluating your product, visiting pricing pages, or requesting demos. Nurture moves people from one to the other.
Every 30-90 days. Run re-engagement campaigns first. Anyone who doesn’t respond to a win-back sequence gets archived. Bad data tanks your deliverability and hurts everyone on your list.
If you’re sending business emails via Gmail or Outlook, the iOS 15 impact is less severe than B2C. But if your contacts read emails on Apple Mail on their phones, expect inflated open rates. Shift your segmentation logic to click-based and behavior-based criteria.
It’s the total revenue value of deals that were touched by at least one nurture email before closing. It’s the clearest way to prove that your email program drives actual business outcomes, not just engagement.
In Klaviyo: Can receive email marketing + AND + Active on site in last 180 days. This segment will be large, open rates will be lower, but it’s where your revenue spikes come from when you hit them with the right offer.
When they’ve hit high-intent signals: pricing page visit, demo request, 3+ content downloads, or a reply to a nurture email. Don’t wait for the sequence to finish. Behavioral triggers should fire the handoff.
Revenue Driven Nurture Performance Metrics Guide
Measure pipeline impact instead of email open rates